There are multiple approaches viable here, like a View or a Report. The one which I found to be most popular however is the Report. This Report is created once, published or saved to a MP, and ready to rock and roll for any other time when needed. One can even schedule the Report – select as output an Excel file – and be send out by mail or put on a file share. Since it is an Excel file one can apply many filters against it in order to drill down into the information.
By default such a Report is not available in SCOM. But with a few mouse clicks – all done from the SCOM Console itself, so no rocket science is required – such a Report is quickly created. This posting will describe how to go about it.
One thing I need to mention: this posting is based on SCOM R2. It should work in SCOM SP1 CU#1 as well though.
First we need to create a Group. This Group is dynamically populated and has some excluded members as well which are all the SCOM R2 Management Servers. Not the Gateway Servers though since these are nothing more but Super SCOM Agents. This Group will contain the Class Health Service.
When this Group is created we check its members and wait for about ten minutes (max). This way the newly created Group has a change to ‘get in to the system’, so the Report we are about to create can use it (the Group must be enumerated). Otherwise we end up with an empty Report when we go too fast. So a bit patience is needed here.
Lets start.
Procedure 01: Creating the Group
- Open the SCOM Console with Admin Permissions;
- Go to Authoring > Groups > right click, select Create a New Group;
- Give it a logical Name with a solid description and save it to a NEW MP;
- Click Next > click on the Dynamic Members link > click Create/Edit Rules;
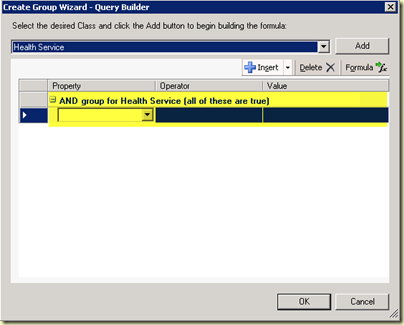
- In the drop down menu select Health Service > click the Add button > nothing else needs to be done > now it looks like this:

- Click OK > now it looks like this:

As you can see, the Query Formula field is almost empty. This speeds up the Group Calculation process and lessens the change that wrong queries are built, since these can really have a negative impact on the RMS; - Go to the Excluded Members section and add the Health Service Class of all the Management Servers;

- Click Create. The Group is now created;
- Check its members. It should be equal to all SCOM Agents WITHOUT the SCOM Management Servers.
- Now go outside and relax for a while. Come back after ten minutes please :).
OK, you’re back? Ten minutes have passed? Time to move on to the next stage.
Procedure 02: Building the Report
- Open the SCOM Console with Admin Permissions;
- Go to Reporting > Microsoft Generic Report Library > open the Custom Configuration Report;
- Click the Add Group button > select the Group we have created earlier;
- In the Report Fields section, select these options:
Network Name
Proxying Enabled
Action Account Identity
Version
Patch List
Install Directory
Install Time
Installed By
Is Manually Installed
Port
Maximum Queue Size
Request Compression
Heartbeat Interval (Seconds)
Send Heart to Management Servers
Number of Missing Heartbeats Allowed - In the From field, open the dropdown menu and select Advanced and create an offset of 7 days for instance;
- Run the Report;
- Tweak when needed;
- Publish or save the report to a MP for later usage.
With this Report you have a good mechanism in place for checking what servers do run an Agent, who installed it and when. Also detailed information about those Agents is displayed.
No comments:
Post a Comment